| x | x | ||||||||||
|
|
 |
||||||||||
| BACTERIOLOGY | IMMUNOLOGY | MYCOLOGY | PARASITOLOGY | VIROLOGY | |||||||
|
|
|
||||||||||
| En Español | |||||||||||
| TURKISH | |||||||||||
| NË SHQIPTARE | |||||||||||
|
Let us know what you think FEEDBACK |
|||||||||||
| SEARCH | |||||||||||
|
|
|||||||||||
|
THIS CHAPTER IS IN SEVERAL PARTS USE THE NEXT>> BUTTON ABOVE TO GO TO THE NEXT PART TO CONTINUE TO VIROLOGY CHAPTER EIGHT CLICK HERE |
|||||||||||
| LINKS TO OTHER HIV AND AIDS SECTIONS ARE AT THE BOTTOM OF THIS PAGE | |||||||||||
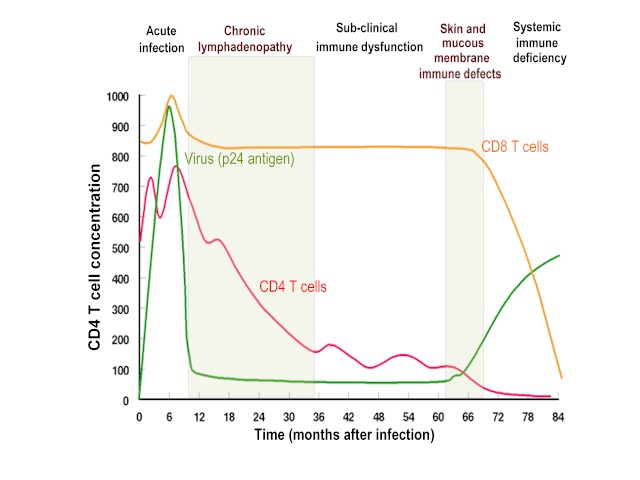
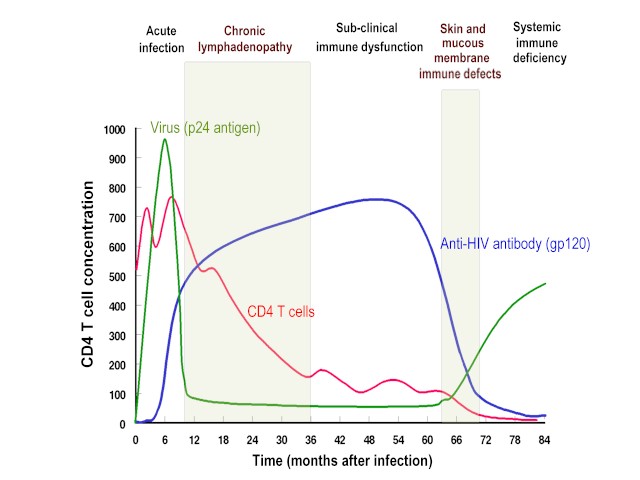 Virus titer, CD4 cell number and anti-gp120 titer during the course of
HIV infection
Virus titer, CD4 cell number and anti-gp120 titer during the course of
HIV infection
Figure 4 |
From the original infection, there is
usually a period of 8 to 10 years before the clinical manifestations of AIDS occur;
however, this period may be two years or less. Approximately 10% of untreated patients
succumb to AIDS within 2 to 3 years.
This period lasts for 6 to 12 weeks after initial infection until anti-HIV antibodies are detectable. If acquired by sexual activity, the virus enters the body in infected macrophages in semen or vaginal secretions. Dendritic cells in the mucosal linings bind the virus shed by macrophages and carry it to the lymph nodes where CD4+ T4 cells become infected. During the course of the disease, the virus migrates to other cell types. Initially, HIV infection produces a mild disease that is self-limiting. This is not seen in all patients and about 30% remain asymptomatic during the initial period of infection. In the period immediately after infection, virus titer rises (about 4 to 11 days after infection) and continues at a high level over a period of a few weeks (figure 4). The patient often experiences some mononucleosis-like symptoms (fever, rash, swollen lymph glands) but none of these is life-threatening. There is an initial fall in the number of CD4+ cells and a rise in CD8+ cells but they quickly return to near normal. At this stage virus titers are very high with as many as one hundred million virus particles per milliliter of plasma. During the first two weeks of infection, CD4+ cells in the lymphoid tissue of the alimentary tract decline. This has two results: local immunodeficiency and chronic immune activation. There is a "window period" of seronegativity during which an infected person does not give a positive western blot HIV test or ELISA, even though the viral load is high and the patient may exhibit some symptoms. This seronegative period can last for six months before seroconversion although the latter usually occurs much earlier.
A strong cell-mediated and humoral anti-HIV immune defense Cytotoxic B and T lymphocytes mount a strong defense and virus largely disappears from the circulation (figure 4). After the increased cell-mediated immune response, there is a rise in humoral anti-HIV antibodies. During this period of strong immune response to the virus, more than 10 billion new HIV particles are produced each day but they are rapidly cleared by the immune system and have a half life of only 5 to 6 hours (Some estimates show a half life of minutes). Although there can be up to 108 virus particles per ml of blood, the number of infectious virus particles is much lower indicating that much of the plasma virus is defective or neutralized. At this stage, most of this virus is coming from recently infected proliferating CD4+ cells (figure 5), including HIV-specific CD4+ cells. Thus, the virus is destroying the very cells that are proliferating to protect against it. The infected cells that are producing this virus are destroyed either by the immune system or by the virus and have a half life about 1 day. However, the rate of production of CD4+ cells can compensate for the loss of cells and a steady state is set up in which most CD4+ cells are uninfected. Although activated proliferating CD4+ cells are destroyed by the immune system,
a small fraction of the infected cells survive long enough to
revert back to the resting memory state (as do non-infected CD4+ memory cells).
The resting memory cells (also referred to as
anamnestic T cells) do not express viral antigens but do carry a copy of the HIV genome which remains latent until the cells are reactivated
by antigen. These memory cells may survive many years and constitute a
reservoir that is very important in drug-based therapy.
A latent reservoir As a result of the strong immune defense, the number of viral particles in the blood stream declines and the patient enters clinical latency (figure 4). Little virus can now be found in the bloodstream or in peripheral blood lymphocytes and, initially, the number of blood CD4+ cells is only slightly decreased. Nevertheless, the virus persists elsewhere, particularly in lymph nodes and here viral replication continues as follicular dendritic cells interact with more CD4+ cells that become infected. The virus is also replicated by macrophages. Although the number of HIV particles in the bloodstream is much reduced during clinical latency, the virus is detectable. After the initial peak of virus, the virus reaches a "set point" during latency. This set point predicts the time of onset of clinical disease. With less than 1000 copies/ml of blood, disease will probably occur with a latency period of more than 10 years. With less than 200 copies/ml, disease does not appear to occur at all. Most patients with more than 100,000 copies per ml, lose their CD4+ cells more rapidly and progress to AIDS before 10 years. Most untreated patients have between 10,000 and 100,000 copies per ml in the clinical latency phase.
Loss of CD4+ cells and collapse of the immune response One reason that the immune system fails to control HIV infection is that the CD4+ T helper cells are the target of the virus. Also follicular dendritic cells can be infected with HIV and these also diminish in number over time. Moreover, dendritic cells present antigen to CD4+ cells and may bring the virus into contact with these cells at the time that they are stimulated to proliferate by antigen. During the course of infection, there is a profound loss of the specific immune response to HIV because:
There is thus a relentless decline of CD4+ cells with especially a loss of those specific to HIV. This occurs from the very beginning of infection and is permanent (unless chemotherapy intervenes). Near the end stage of AIDS, CD8+ cells also decline precipitously. It is nevertheless the case that during the course of HIV infection, most CD4+ cells are never actually infected by the virus but die from some other means (see below).
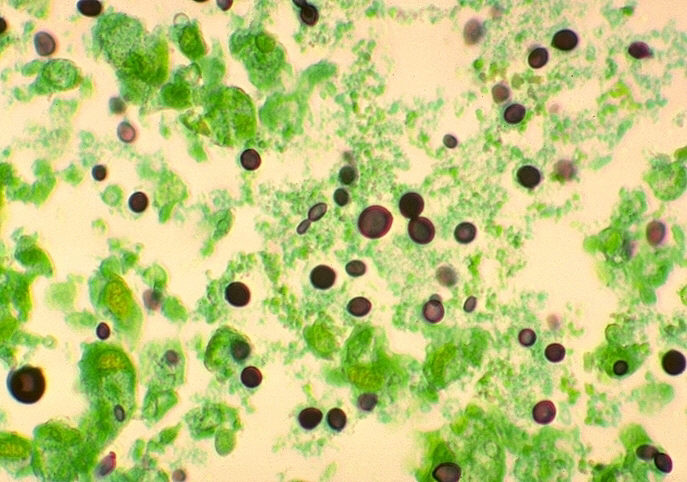
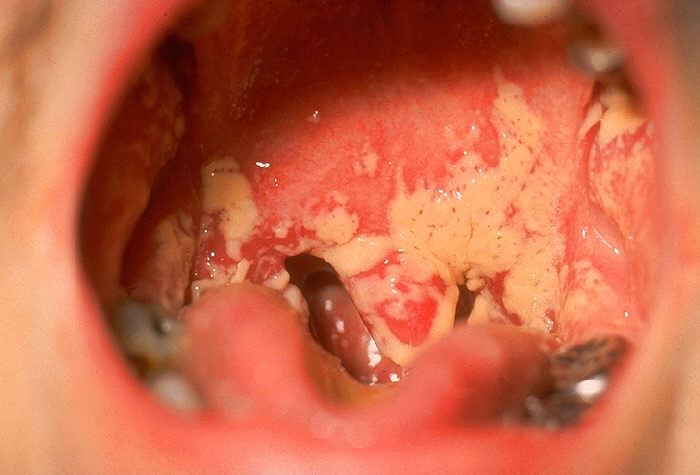
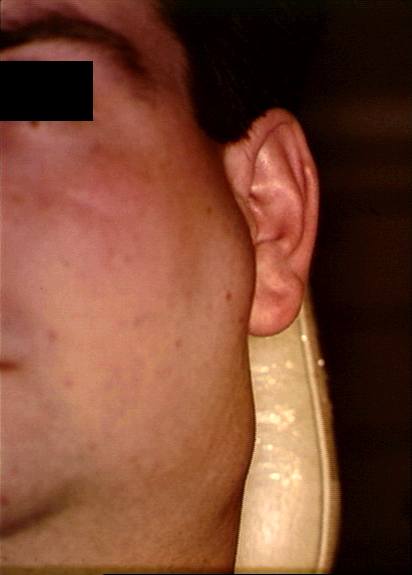
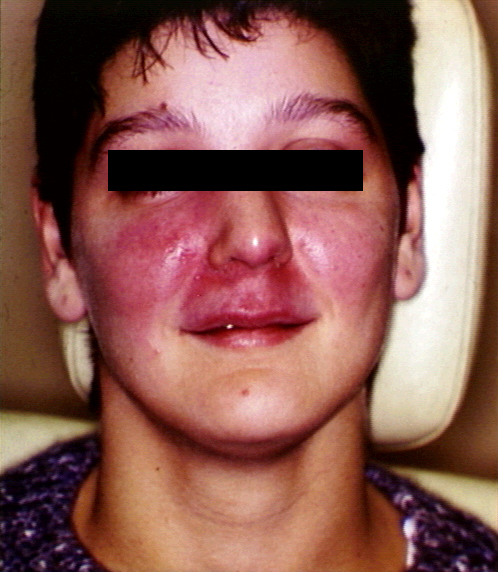
Onset of disease - AIDS The period of clinical latency varies in length from as little as 1 to 2 years to more than 15 years. Onset of AIDS is rare in less than 3 years except in children. But, eventually, the virus can no longer be controlled as helper CD4+ (T4) cells are destroyed (figure 4). Ironically, the killer cells needed to control HIV also damage the helper T cells that they need to function efficiently. With the lack of CD4+ cells, new cytotoxic T cell responses cannot occur as helper cells are lacking and such new responses are required as the virus mutates. As the CD4+ cells fall below 200 per cu mm, virus titers rise rapidly and immune activity drops precipitously. It is the loss of immune competence that enables normally benign opportunistic parasites such as other viruses, fungi or protozoa to cause infections (figure 6A and B). Once AIDS develops, patients rarely survive more than two years without chemotherapeutic intervention. (See anti-HIV chemotherapy chapter). There is considerable variability at this stage. Some patients with clinical AIDS do survive for several years while others who appear relatively healthy can suddenly succumb to a major opportunistic infection. It is the onset of HIV-associated cancers and opportunistic infections that defines AIDS proper. At this stage, also, syncytium-inducing HIV appear in many (about half) AIDS patients (see below). These are more CD4+ cell tropic than the initially infecting HIV and this contributes to the rapid loss of CD4+ cells in later stages of the disease.
It should be noted that a phase of HIV infection,
AIDS-related
complex (ARC), used to be defined. This is now little used. It is the phase
of the disease that lacks the neoplasms and opportunistic infections that are the
definition of AIDS. Patients at this stage of the disease show weight loss and
fatigue together with fungal infections of the mouth, finger and toe nails. |
||||||||||
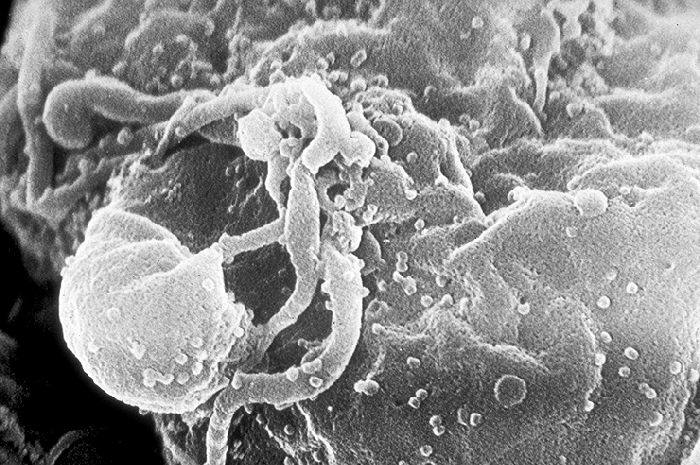
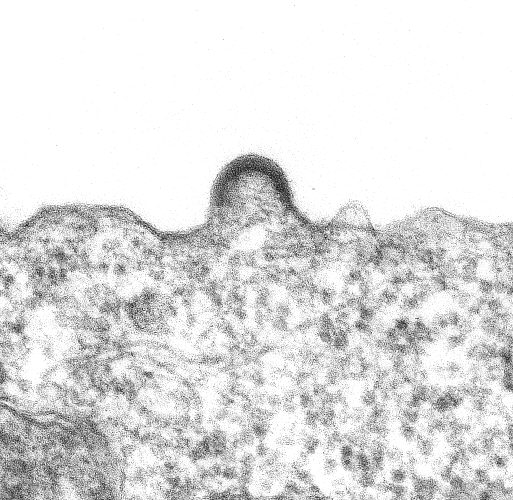 HIV-1 budding from cultured lymphocyte. Transmission electron micrograph.
CDC/Dr. Edwin P. Ewing, Jr.
epe1@cdc.gov
HIV-1 budding from cultured lymphocyte. Transmission electron micrograph.
CDC/Dr. Edwin P. Ewing, Jr.
epe1@cdc.gov
Figure 5 |
|||||||||||
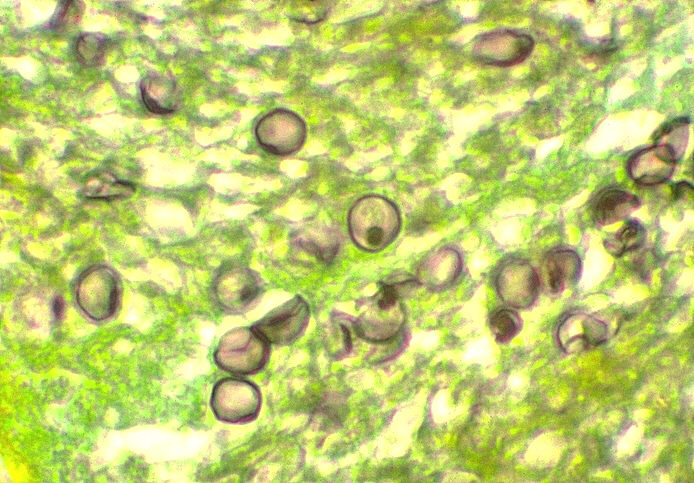
 Figure 6A Figure 6AThe natural history of an HIV infection. Opportunistic infections during the course of the disease |
|||||||||||
|
Figure 6B (right) - AIDS related diseases |
|
||||||||||
 Rate of progression to
AIDS associated with homosexuality and hemophilia
Rate of progression to
AIDS associated with homosexuality and hemophilia HIV-HS: HIV negative homosexual. HIV+ HS: HIV positive homosexual Figure 7
|
children progress faster to aids than adults The mean time from seroconversion to onset of disease is approximately 9 years (figure 7). The time is similar whether the virus was acquired by sexual behavior or the use of clotting agents. Perinatally-infected infants progress faster. Signs of AIDS can be seen by 5 months in more than 80% of seropositive children. Without therapy, about half die by nine years of age. In neonates, the level of viral RNA rises rapidly in the first few months of life but does not decline as rapidly as is seen in adults. The decline that occurs takes place over a period of a year or more. This presumably reflects the less effective infant immune system. As in adults, the level of HIV RNA predicts the rapidity of progression to AIDS. There are a variety of factors that determine progression of an HIV infection to clinical AIDS disease
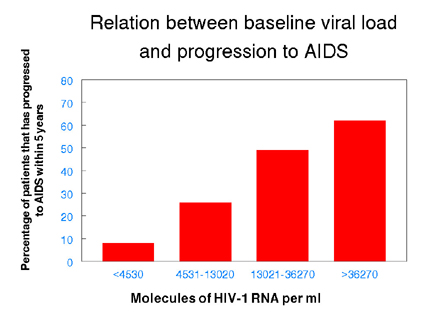
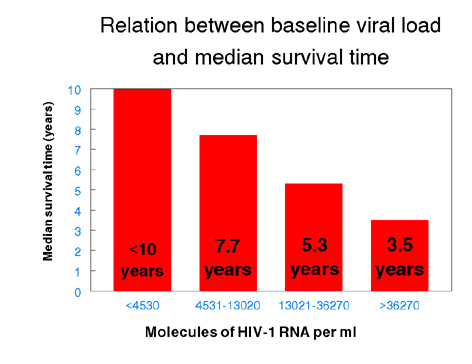
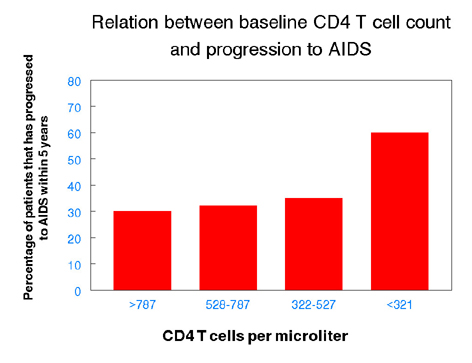
HIV load but not CD4+ T cell number is a good indicator of rapid progression to AIDS The onset of AIDS occurs, on average, about 9 years after infection but in the absence of treatment some individuals progress much faster. About 20% of patients exhibit AIDS symptoms within 5 years of infection while others remain disease free much longer than average. The onset of AIDS correlates with the diminution of the number of CD4+ T cells but the major loss of T cells occurs late in infection. A marker that could predict the prognosis for AIDS progression early in the disease would be useful. Not surprisingly, the initial baseline viral load (that is when the patient is first monitored for virus number) is a good predictor of the time it will take for disease to appear. CD4 cell number is not a good predictor until late in the course of infection (figure 8).
|
||||||||||
|
Figure 8 - Predictors of progression to AIDS
|
|
||||||||||
|
|
|||||||||||
|
|
|
||||||||||
|
|
|||||||||||